


You’ve done the work. You’ve built the automated sales funnel, launched the lead magnet, and implemented the nurturing sequence. Now what? It’s time track these essential website automation KPIs.
Many business owners make the mistake of celebrating the launch and then just crossing their fingers. They look at vanity metrics like total website traffic or email open rates without connecting them to the bottom line.
At Vsmith Media, we know that if you can’t measure it, you can’t improve it. To ensure your automated website funnel is a profit center, not just a content dump, you must focus on Key Performance Indicators (KPIs) that directly map to revenue and efficiency. Understanding and tracking your website automation KPIs is non-negotiable for success.
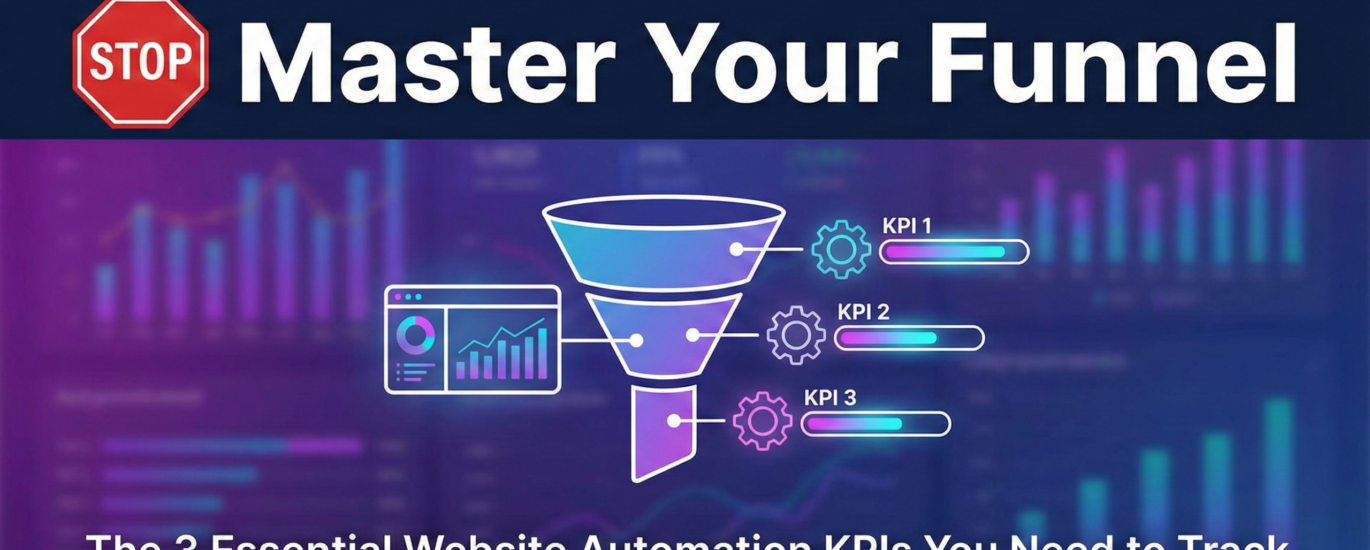
Forget the dozens of metrics available in your analytics dashboard. Here are the 3 essential website automation KPIs you must track to move From Interest to Invoice.
Essential Website Automation KPIs 1: Stage-to-Stage Conversion Rate
This is the most critical metric for identifying the “leaks” in your sales funnel. Instead of tracking the overall conversion rate (Visitor to Customer), you break the funnel down into its automated stages and measure the drop-off between each one.
What It Measures
The efficiency of each automated touchpoint in moving a lead to the next stage.
{Stage Conversion Rate} = {Leads in Current Stage}{Leads in Previous Stage}\times 100$$
Key Stages to Track in Automation
- Visitor $\to$ Lead (Landing Page Conversion Rate): Measures the effectiveness of your lead magnet and landing page copy.
- If low: The problem is likely your headline, CTA, or lead magnet value proposition.
- Lead $\to$ Marketing Qualified Lead (MQL): Measures the effectiveness of your welcome/nurture sequence (Are they clicking key links, viewing case studies, or achieving a certain lead score?).
- If low: The problem is likely your email content, sequencing, or value alignment.
- MQL $\to$ Customer/Opportunity (Final CTA Conversion Rate): Measures how well your low-friction offer converts nurtured leads into first-time buyers or appointments.
- If low: The problem is likely the offer itself (price, perceived value, or friction in the checkout/booking process).
💡 The Takeaway: A low overall conversion rate is a symptom. The Stage-to-Stage Rate is the diagnostic tool that tells you exactly where to focus your optimization efforts.
Essential Website Automation KPIs 2: Customer Acquisition Cost (CAC)
Automation is supposed to save you time and money, but if your systems are complex and expensive to maintain or if you are spending heavily on ads to drive top-of-funnel traffic, your CAC can creep up quickly.
What It Measures
The total expense (marketing, software, labor) required to acquire one paying customer.
{CAC} = \frac{\text{Total Sales & Marketing Expenses}{Number of New Customers Acquired}
Why It’s Essential for Automation
- Justified Tech Spend: If your CRM, email platform, and landing page tools cost you $$500$ per month, and you acquire 50 customers, that’s $$10$ in software cost per customer. CAC helps you justify or downsize your tech stack.
- Optimizes Channel Spend: By tracking CAC for leads coming from different sources (e.g., Google Ads vs. Organic Search), you can double down on the channels that deliver customers most efficiently.
- Identifies Funnel Efficiency: If your funnel is performing well (high Stage Conversion Rate), your ad spend (a major component of CAC) should become more efficient over time, resulting in a lower CAC.
💡 The Takeaway: CAC is the true measure of your funnel’s financial efficiency. A low CAC means your automated system is a well-oiled machine that is generating a high Return on Investment (ROI).
Essential Website Automation KPIs 3: Sales Cycle Length
Automation’s biggest promise is speed. A lead that might take a sales rep three weeks of manual follow-up to warm up can be automatically nurtured to a conversion-ready state in three days. The Sales Cycle Length measures this efficiency.
What It Measures
The average time it takes for a newly captured lead to complete the final desired conversion (e.g., from landing page submission to first invoice/purchase).
{Sales Cycle Length} = \{Total Days to Close All Deals}{Total Number of Closed Deals}
Why It’s Essential for Automation
- Identifies Bottlenecks: If you notice the average Sales Cycle Length increasing, it means leads are getting stuck somewhere. Is the final booking link broken? Is the email sequence too long?
- Forecasts Revenue: Knowing your average cycle length allows you to predict future revenue with confidence. If you captured 100 new leads today and your cycle is 7 days, you can accurately forecast how many of those will convert by next week.
- Highlights Automation Value: A significantly shorter sales cycle compared to your pre-automation process is a clear, undeniable demonstration of the value of your automated system.
Move from Monitoring to Mastering
Tracking traffic is like watching the weather; tracking these 3 website automation KPIs is like monitoring the engine of your business. By focusing your analysis on Stage-to-Stage Conversion Rate, Customer Acquisition Cost, and Sales Cycle Length, you stop managing guesswork and start mastering the science of automated sales.
Ready to gain absolute clarity on your funnel performance?
💡 Would you like Vsmith Media to help you set up an analytics dashboard specifically to track and visualize these three essential automation KPIs?